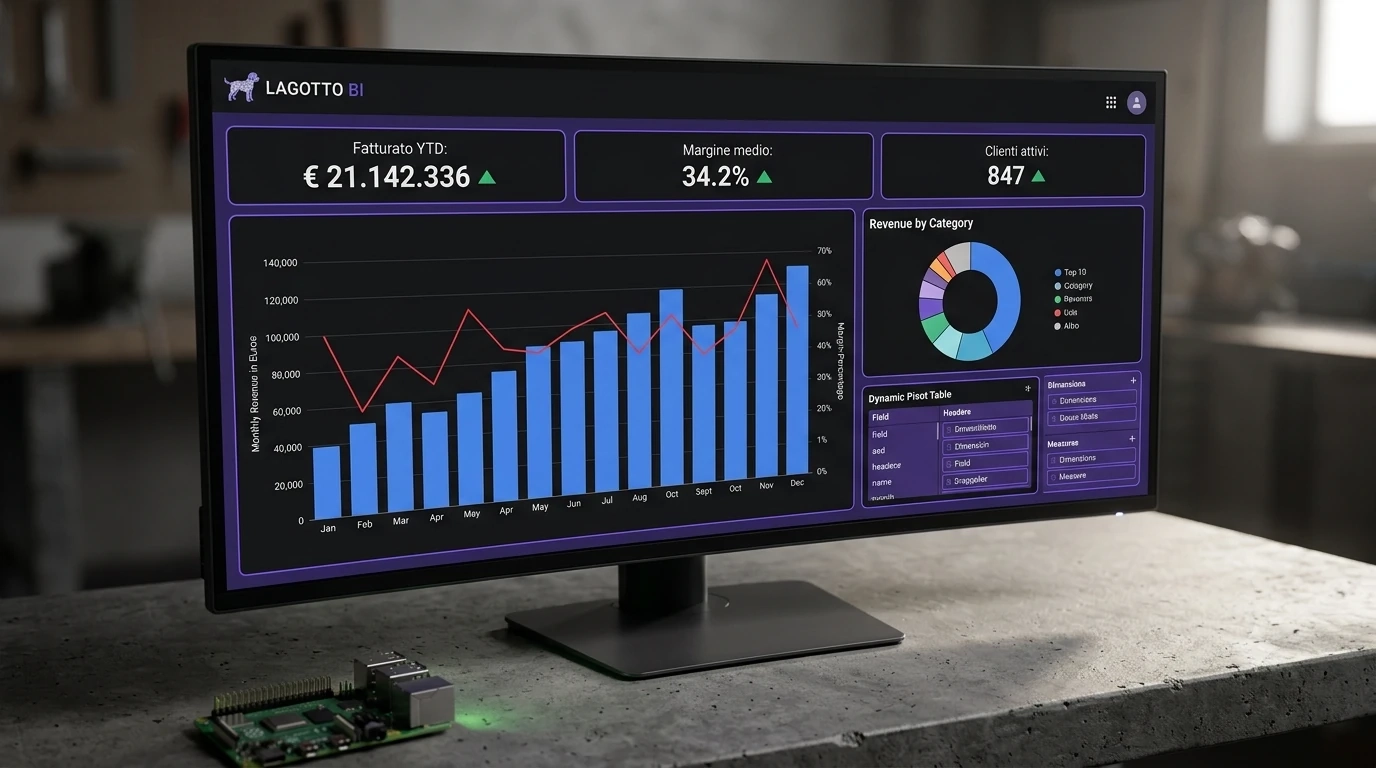
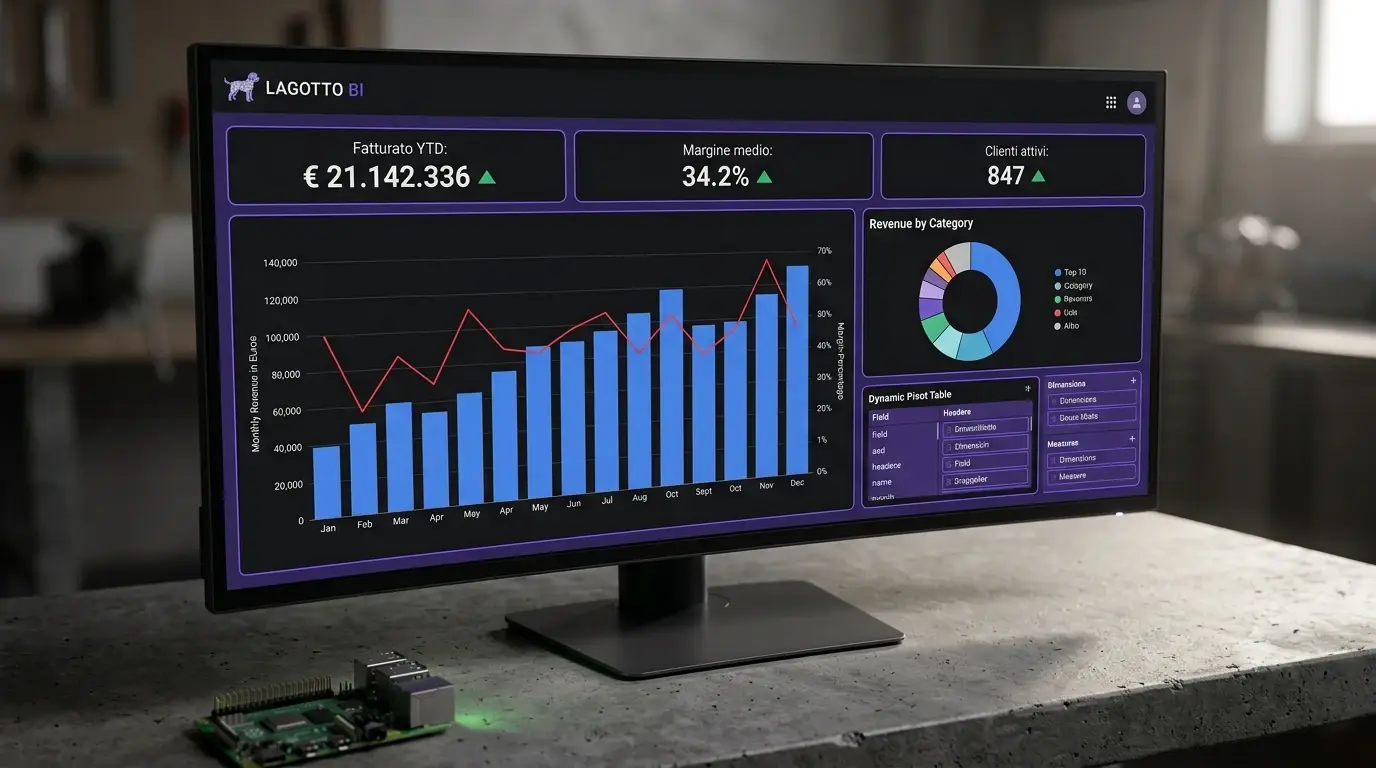
Lagotto BI — Architecture and Technical Overview
Lagotto BI reads from an MSSQL ERP, synchronizes data to an internal MariaDB database every 5–15 minutes, and exposes it through drag&drop configurable dashboards without writing code. The time between “I haven’t connected the ERP yet” and “I have a dashboard with real data” is measured in wizard steps, not weeks of custom development.
Technical Stack
| Component | Technology |
|---|---|
| Backend | FastAPI (Python 3.11+), SQLAlchemy 2.x async, MariaDB |
| Source connector | pymssql — read-only, never writes to the ERP |
| Sync | APScheduler — incremental 5–15 min, zero-downtime nightly full sync |
| Frontend | Vue 3 + Vite + TypeScript, Pinia |
| Charts | Apache ECharts (tree-shaken, only used modules) |
| Tables / Pivot | Tabulator 6 / pivottable.js |
| Isolation | Dedicated MariaDB schema per tenant — no data shared between clients |
Real Configuration Times
Every step has an integrated test or preview. Nothing is ever saved blind.
| Step | What happens | Typical time |
|---|---|---|
| 1. ERP connection | 5-step wizard: host, port, credentials, schema registry, live connection test before saving | 3–5 minutes |
| 2. Schema mapping | Mapper Builder: visual field→field wizard, predefined transformations, test with 50 real row preview before saving | 10–20 minutes per table first time — instant on already certified schema |
| 2b. Full table import | 3-step wizard: MSSQL table → MariaDB staging, no field-by-field mapping needed | 2–3 minutes |
| 3. First sync | Automatic — incremental every 5–15 minutes, configurable per datasource | Data available within 15 minutes |
| 4. First dashboard | Drag&drop grid, every widget with live preview during configuration | 1–2 minutes per widget |
| 5. Filters and drill-through | Filter wizard with automatic cross-view propagation | 2–3 minutes per filter |
From unconnected ERP to dashboard with real data: the order of magnitude is half an hour, not the typical analysis-quote-development-testing cycle of a custom BI project.
Aggregation Engine
The difference that is least visible but weighs most: aggregation happens on the database, not in the browser. A chart with Top 10 + “Other” on a view with hundreds of thousands of rows does not download those rows to the browser to then slice them in JavaScript — the backend executes GROUP BY + SUM with ordering already applied, returning only the rows that will be rendered.
GET /api/data/v_monthly_revenue ?_top_n_x=month&_top_n_y=total&_top_n=10&_grouping=customer_region-- generated by backend, parameterized — never string interpolationSELECT month, customer_region, SUM(total) AS totalFROM v_monthly_revenueWHERE year = :yearGROUP BY month, customer_regionORDER BY SUM(total) DESCThe Pivot widget (PRO) follows the opposite logic when needed: raw data without LIMIT, aggregated client-side by pivottable.js. Verified on 100,576 real rows with € 21,142,336 summed in real time while the user drags fields.
An in-memory cache (TTL 60 seconds, per user) prevents a tab switch or double-click on a filter from regenerating the same query twice.
Widget Catalog
Seven widget types, all configurable from the panel — none require hand-written JSON.
| Widget | Tier | What it does | What sets it apart |
|---|---|---|---|
| KPI | FREE | Single value with previous period comparison and automatic formatting | Period-over-period delta calculated automatically |
| Bar / Line | FREE | Bar and line charts, single or multi-series | Multi-series backward compatible |
| Bar — variants | FREE | Stacked bars, horizontal bars, values above/beside | Configurable by checkbox |
| Pie / Donut | FREE | Absolute value, percentage or both; Top-N with “Other” entry | Server-side aggregation |
| Table | FREE | Tabulator with pagination, sorting, aggregated columns | Automatic per-column formatting |
| Combo | PRO | Mixed bar + line series, dual Y axis | Each series independently chooses axis, type and color |
| Pivot | PRO | Interactive pivot on raw data, draggable rows × columns | No backend row limit; Excel export with one click |
Example: combo chart configuration
{ "type": "combo", "title": "Revenue vs margin", "view": "v_monthly_margin", "x_axis": "month", "series": [ { "field": "revenue", "label": "Revenue", "type": "bar", "y_axis": "left", "color": "#4a90d9" }, { "field": "margin_pct", "label": "Margin %", "type": "line", "y_axis": "right", "color": "#e85d4a" } ]}This JSON block — generated by the Widget Builder, never hand-written — is all that is needed for a chart that in many BI tools requires a dedicated SQL view plus manual configuration of the second axis.
Actions and drill-through
Every widget can react to a click. The drill-through stack is recursive — a click inside a modal opened by a previous click opens a third level, with breadcrumbs to go back. Configurable from the panel, not from code.
| Action | Behavior |
|---|---|
open_table / open_bar / open_pie / open_line / open_pivot | Opens a fullscreen modal with the chosen widget, filtered on the clicked value |
open_customer | Navigates to a specific dashboard, pre-filtered on the selected customer |
filter_dashboard | Applies a global filter to the entire current dashboard |
Mapper Builder and Query Manager
Every ERP has a JSON file mapping its tables to Lagotto’s standard schema:
{ "erp": "custom_erp", "tables": { "INVOICE_HEADERS": { "target_view": "v_monthly_revenue", "columns": { "DOC_DATE": { "target": "invoice_date", "type": "date" }, "CLIENT_CODE":{ "target": "client_code", "type": "string" }, "DOC_TOTAL": { "target": "revenue", "type": "decimal", "display": { "type": "currency", "symbol": "€", "decimals": 0 } } } } }}Six predefined transformations cover the cases that normally end up in a hand-written script:
simple— direct copymap— dictionary lookuplookup— external table (e.g. province→region)coalesce— first non-null value among multiple fieldsconcat— concatenationarithmetic— sum/subtraction between fields
The display field automatically propagates formatting all the way to the final widget without configuring it a second time.
Query Manager (View Builder, PRO): SQL editor with the panel of staging tables available for that datasource. A view created here is available in the Widget Builder immediately — no backend restart, no deploy.
-- margin by category, calculated in a custom viewCREATE OR REPLACE VIEW v_category_margin ASSELECT category, SUM(revenue) AS total_revenue, SUM(cost) AS total_cost, ROUND((SUM(revenue) - SUM(cost)) / NULLIF(SUM(revenue),0) * 100, 1) AS margin_pctFROM raw_revenueGROUP BY categorySecurity and Multi-Tenant Isolation
- Mandatory view whitelist: the data endpoint only accepts views in the explicit whitelist — no arbitrary queries from the frontend
- Always parameterized queries: never string interpolation, even for column names with spaces or accented characters
- Server-side forced agent filter: a user with
agentrole sees only their own data — the filter is applied in the backend, not bypassable from the frontend - Schema per tenant: every client has their own MariaDB schema (
lagotto_{slug}) — zero shared data, zero cross-tenant queries possible by construction - Granular per-user profiling: an admin can restrict which dashboards, tabs, widgets and permanent filters a single user sees — filtered server-side
Plans and Licensing
| Plan | Dashboards | Widget Builder | Pivot / Combo | Datasources | Users | Price |
|---|---|---|---|---|---|---|
| Starter | 10 standard | — | — | 1 | 1 | Always free |
| Professional | Unlimited | ✓ | ✓ | 3 | 5 | Dynamic — see pricing |
| AI | Unlimited | ✓ | ✓ | Unlimited | >100 | On request |
The user limit is verified server-side on every new user creation. The plan is re-verified live against the License Server every 30 minutes — revocations and upgrades propagate without restarting anything. Prices shown to the user are read in real time from the License Server, not a fixed number in the code.
Performance — Numbers, Not Adjectives
| Metric | Value |
|---|---|
| Incremental sync interval | 5–15 minutes, configurable per datasource |
| Downtime during nightly full sync | Zero — shadow table + atomic RENAME TABLE |
| Data cache per widget | 60 seconds per user, invalidated on filter change |
| Rows aggregated in pivot | 100,576 real rows verified |
| Value summed in real time | € 21,142,336 |
| Plan change propagation latency | 30 minutes maximum |
Declared Roadmap
Not yet in production:
- Extended Query Manager: materialize a query result into a staging table, not just a view calculated on every read — for heavy joins on millions of rows
- Certified mapper library: export/import a tested mapping schema between different installations of the same ERP
- Full dashboard import/export: layout, widgets and filters as an exportable file, reusable as a starting point for a new client
Technical document — Lagotto BI. Roadmap features are not yet available in production.
Sources
Author: Giantommaso Fogli
Publication Date: 2026-07-09
Rights and attributions
Images, logos and photographs are the property of their respective owners. Used for commentary purposes.
← Back to journal