We don't pay for web analytics. Ours are live, public, and open to everyone — right now
If you have a website and you’re paying someone to manage it, at some point you’ve received a report. Maybe a PDF. Maybe a link to a dashboard with nice colors. Numbers, charts, percentages.
The question most people never ask is: who chose those numbers?
Tools like Google Analytics, third-party Matomo, or agency dashboards all have one thing in common: the data always passes through someone before it reaches you. Filters, sampling, bots excluded or included at will, sessions counted differently depending on the tool. It’s not necessarily bad faith — it’s that every platform has its own rules, and someone else decides those rules.
The result? Your site might show “10,000 monthly visits” in one tool and 4,200 in another. Both are telling the truth. Their truth.
GoAccess: the tool professionals know, but rarely show
GoAccess is a free, open source tool used by sysadmins and developers worldwide. It reads directly from the real nginx server logs — those plain text files where the server records every single incoming request, with IP, timestamp, requested URL, response code, and user agent.
No intermediary. No sampling. No JavaScript to load on the page.
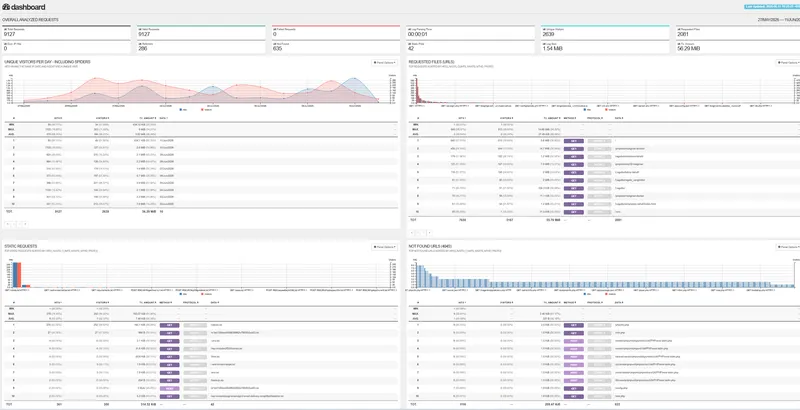
The problem is that GoAccess raw output — table after table of technical data — is perfectly readable for a sysadmin and perfectly indigestible for everyone else. It’s like handing the client the ship’s logbook instead of a map. That’s why almost nobody shows it to clients.
What we built
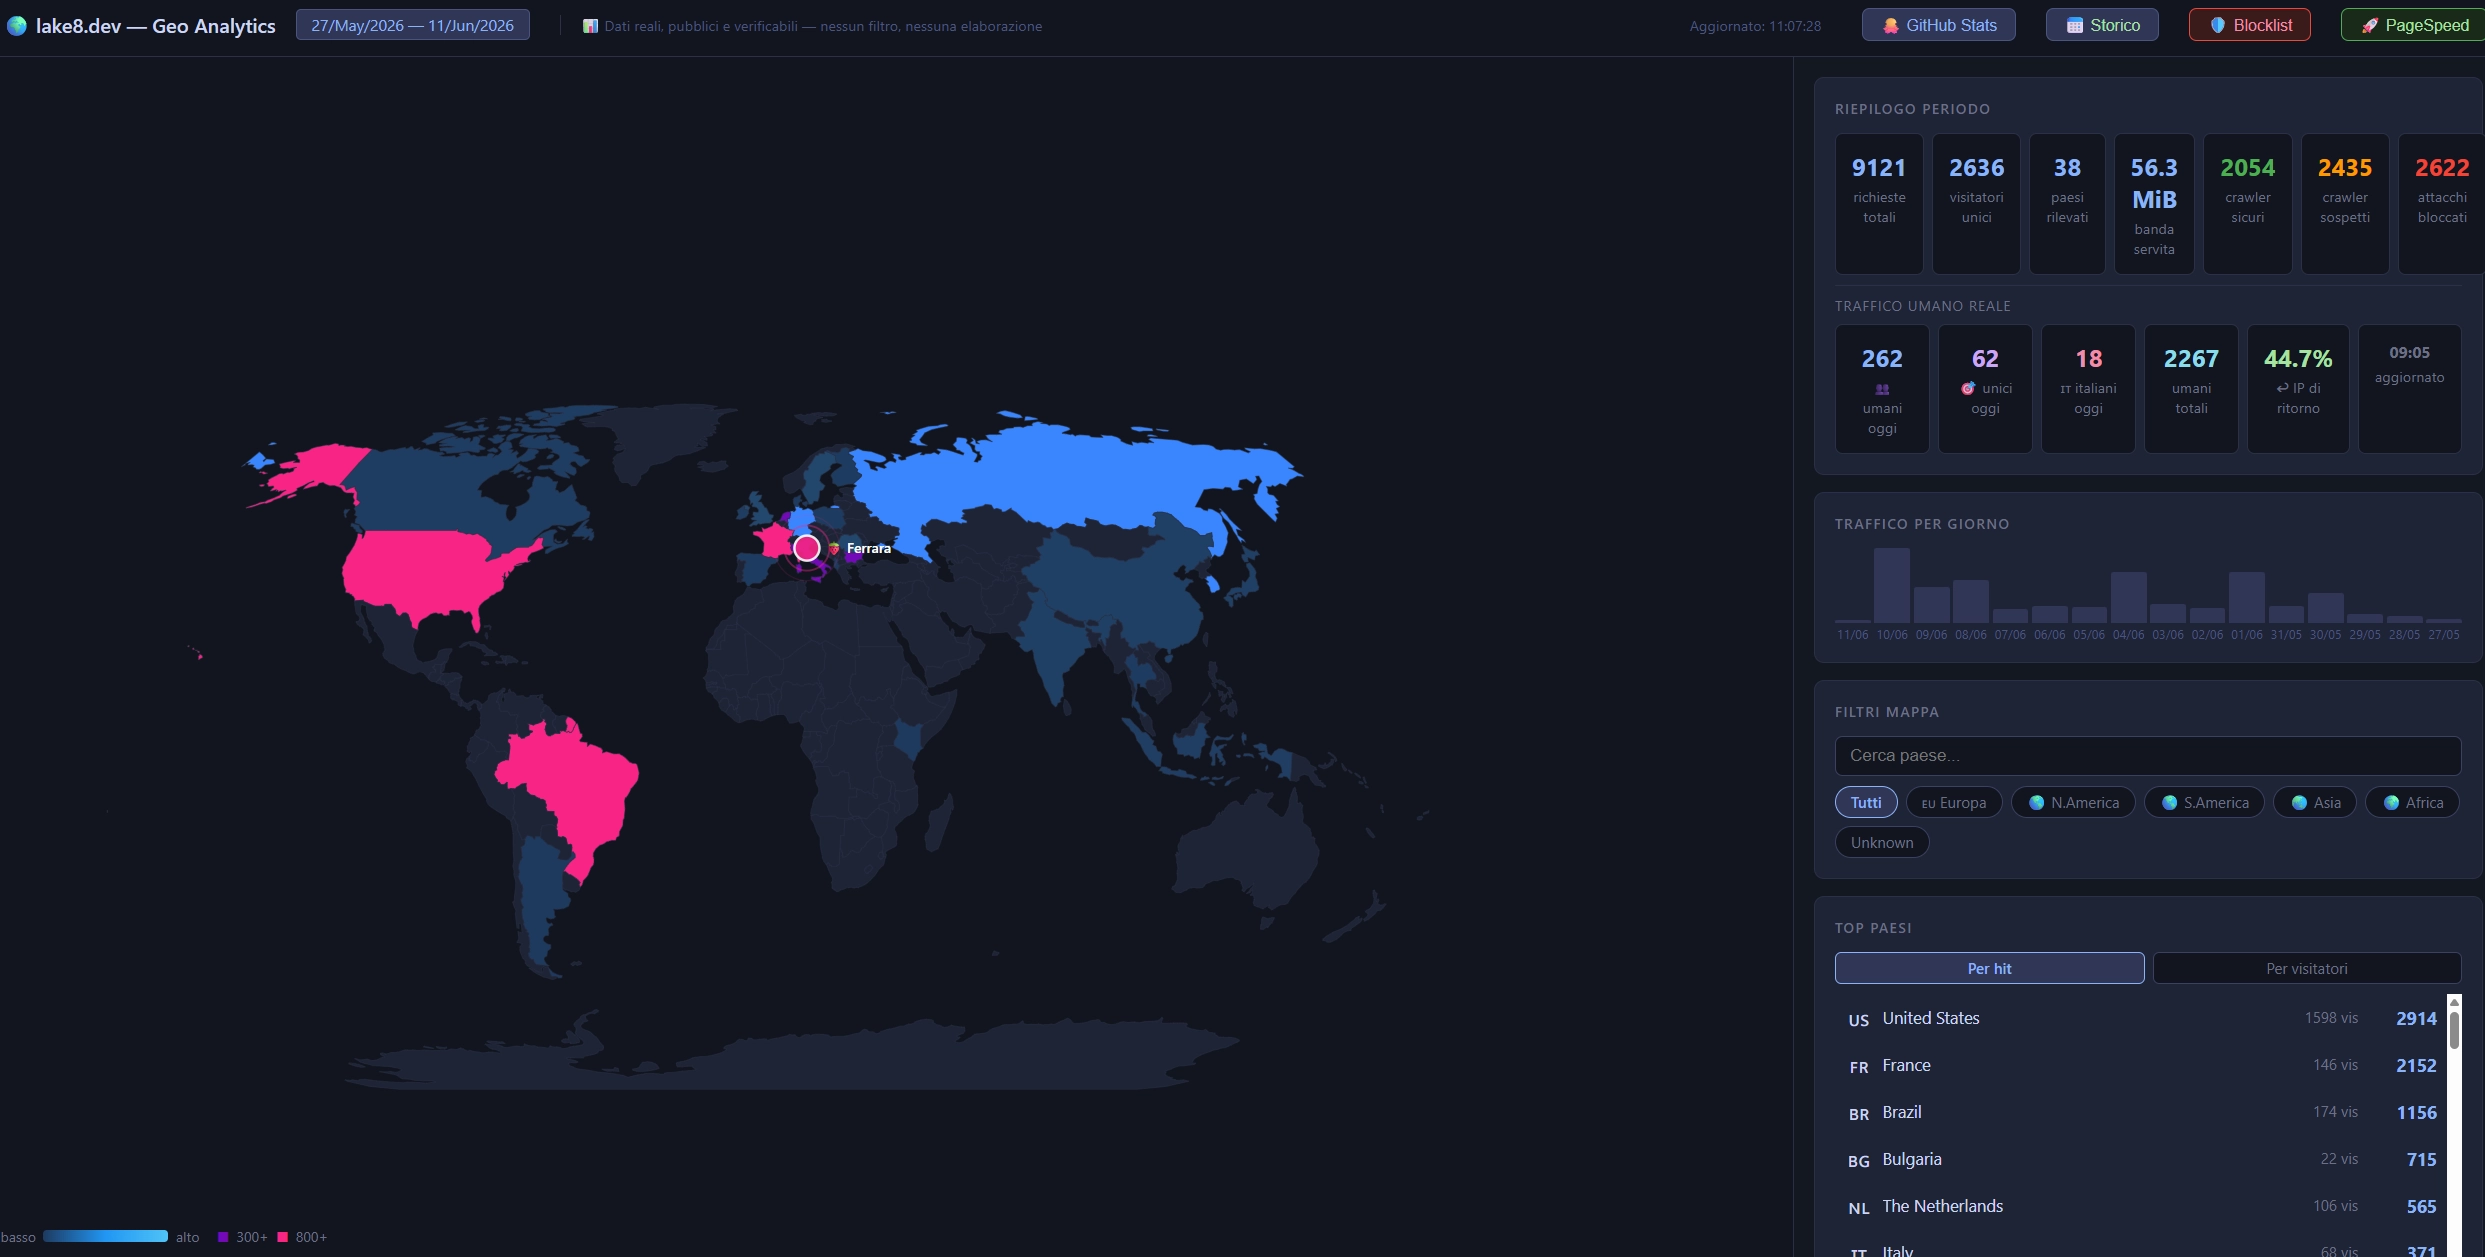
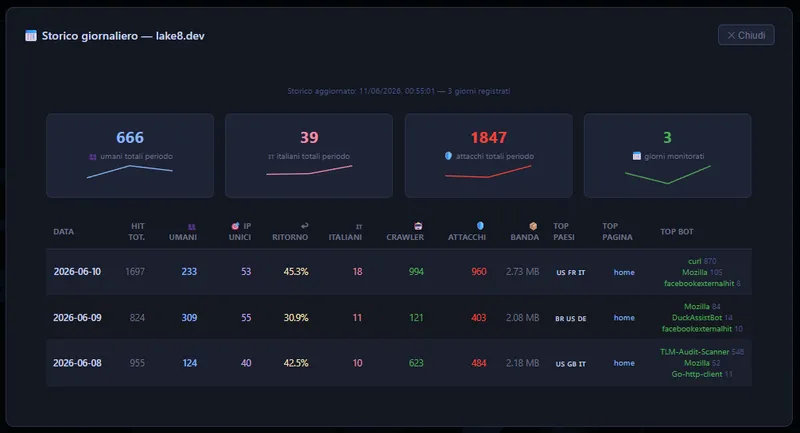
We took GoAccess, let it do its job on the real lake8.dev logs, and built geo.html on top of it — our custom geographic dashboard.
An interactive world map. Countries colored by real traffic. Bots separated from humans. Peak hours. Crawlers identified by name. And at the bottom, our favorite part: a public list of IPs that attempted attacks on the site, with the exact number of attempts and the URLs they tried to reach.
The system identifies unauthorized access attempts in real time and blocks them automatically — no manual intervention, no waiting for any update.
No subscriptions. No extras. Runs on a Raspberry Pi in our office, but would perform even better on a cloud VPS.
And above all: it’s public. Anyone can open it right now, while reading this article, and see the exact same numbers we see.
Real numbers — nothing excluded
From the last 15 days of lake8.dev data (May 27 — June 10, 2026):
- 8,761 total requests to the server
- 64% non-human traffic — crawlers, bots, automated scanners
- 36% real human traffic — actual people reading actual pages
- 31 IPs blocked on the night of June 10–11, with 2,326 attempts to access configuration files, cloud credentials, and non-existent WordPress panels
Those 31 blocked IPs are not an anomaly. This is the normal state of the web. The difference is that we know it, we show it, and our system identifies and blocks them in real time.
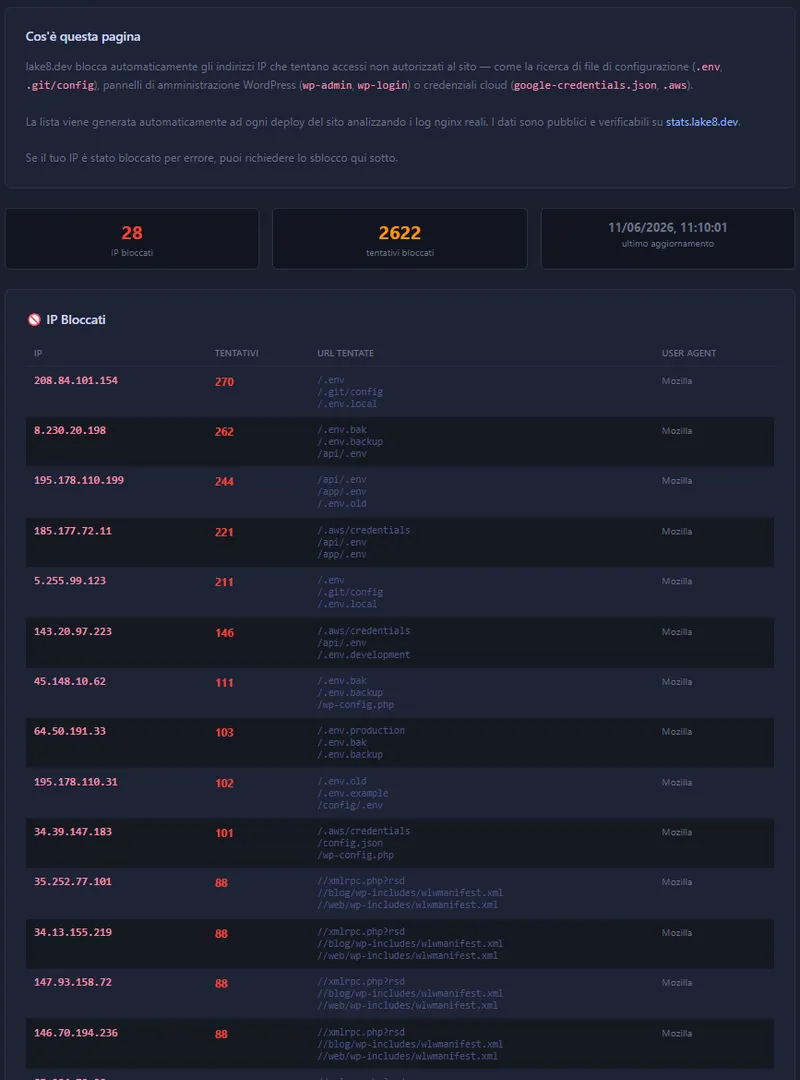
Most dashboards sold to clients show only the “clean” traffic. And that number looks a lot prettier.
Total transparency. Maybe too much
We didn’t stop at site statistics.
The dashboard also includes data from our public GitHub repositories — commits, activity, open projects. All visible, all verifiable, in real time.
It’s a deliberate choice, and a slightly reckless one. It means showing not just that the site performs well, but that there’s real, continuous, traceable work behind it.
When everything is in plain sight, there’s no room to tell it differently from how it is.
See it yourself
The dashboard is open, right now, no login required:
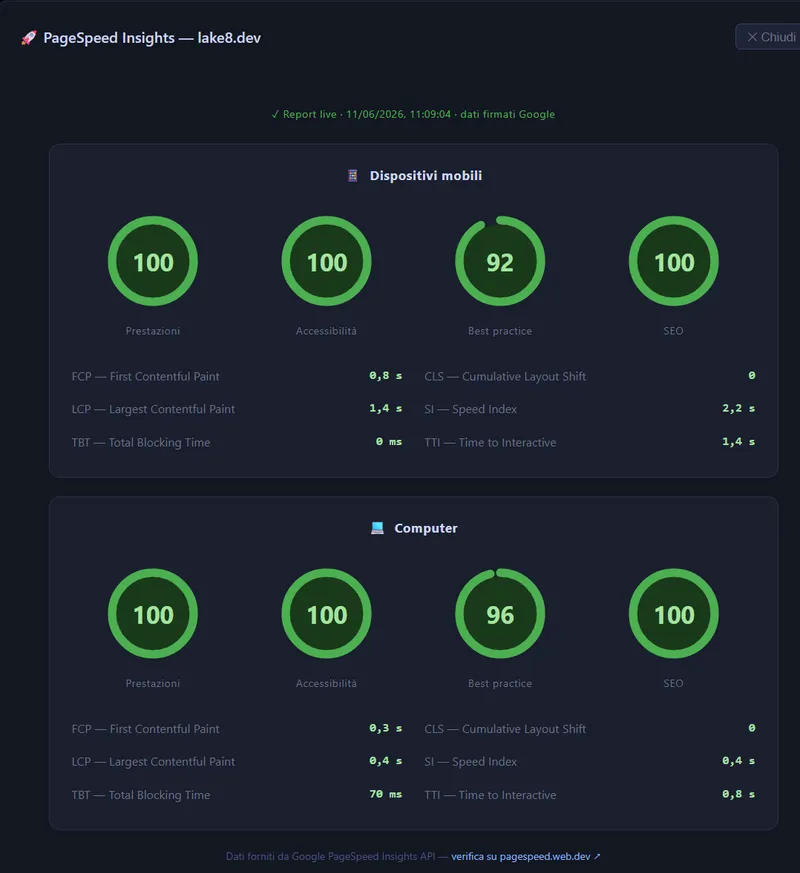
You’ll find the geographic map, daily traffic, identified crawlers, the blocked IP list, and live PageSpeed scores signed directly by Google.
If after seeing it you want to know how it works, or you’d like something similar for your own site — you know where to find us.
Pros and Cons
| Pros | Cons |
|---|---|
| Real data straight from nginx logs, no intermediary | Requires direct server access (own server or cloud VPS) — not plug-and-play |
| Free — GoAccess is open source | Raw output requires customization to be readable by non-technical users |
| Dynamic blocklist updated in real time | Non-trivial initial setup curve |
| Public dashboard, verifiable by anyone | No dedicated mobile app |
| Live PageSpeed signed by Google, not a screenshot | Depends on the quality of nginx logs |
Sources
Author: GTF — lake8.dev
URL: https://stats.lake8.dev/geo.html
Publication date: 2026-06-11
Diritti e attribuzioni
Immagini, loghi e fotografie citati o mostrati in questo articolo sono di proprietà dei legittimi titolari. Non si intende violare alcun diritto: i materiali sono utilizzati in relazione a fonti terze e con finalità di commento.
Rights and Attribution
Images, logos, and photographs cited or shown in this article are the property of their respective owners. No rights are intended to be infringed: materials are used in relation to third-party sources and for commentary purposes.
← Back to blog